Example 1
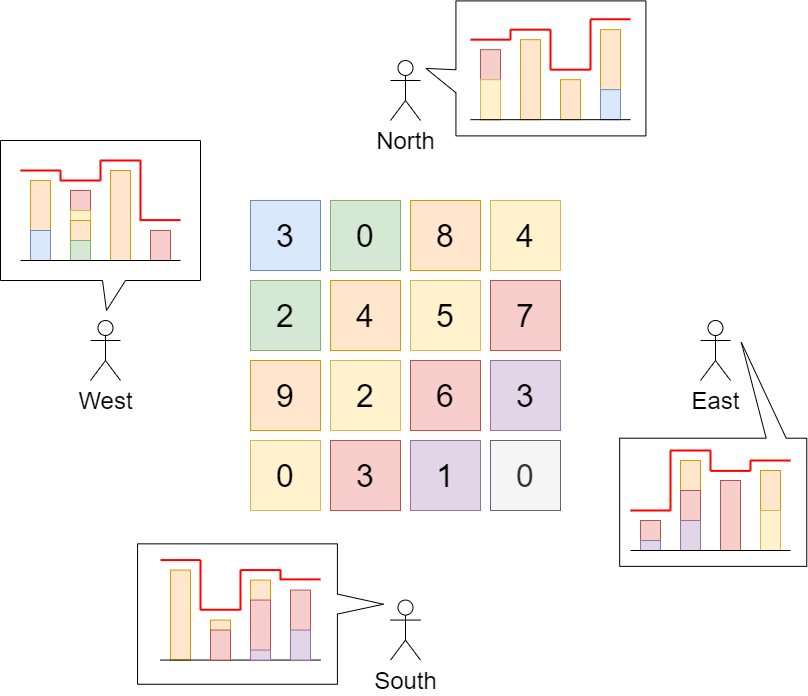
Input: grid = [[3,0,8,4],[2,4,5,7],[9,2,6,3],[0,3,1,0]]
Output: 35
Explanation: The building heights are shown in the center of the above image.
The skylines when viewed from each cardinal direction are drawn in red.
The grid after increasing the height of buildings without affecting skylines is:
gridNew = [ [8, 4, 8, 7],
[7, 4, 7, 7],
[9, 4, 8, 7],
[3, 3, 3, 3] ]
Example 2
Input: grid = [[0,0,0],[0,0,0],[0,0,0]]
Output: 0
Explanation: Increasing the height of any building will result in the skyline changing.